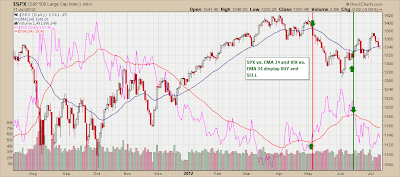
One simple indicator to catch the "right" side of the market is a comparison of the S&P500 daily chart with the VIX. Both are plotted with a 34-day exponential moving average.
Note the chart below. When VIX is below its 34-day EMA, the S&P500 is generally in an uptrend. When VIX is above its 34-day EMA, as it was starting in early May 2012 through mid-June, the S&P500 was falling. This signal system will generate whipsaws and is not perfect in any sense. But it represents yet another simple approach to identifying the major intermediate-term trend so that investors can remain on the "right" side of the market. Click here to visit Baseline Analytics TrendFlex, which incorporates several indicators like that one below, to identify (and stick with) the major trend.
Wednesday, July 11, 2012
Subscribe to:
Post Comments (Atom)

No comments:
Post a Comment