Saturday, December 19, 2009

Can't ignore the positive signals

Market uptrend bias continues, with renewed strength in NASDAQ and small caps. Continued weakeness in financials overhangs the markets, as does a firming in the dollar. Many foreign ETF's have begun to downtrend; they were early leaders in the recovery and benefited from a weaker dollar. Their tiring uptrend (see EFA, EMA, EPP, EPI) and the dollar's bounce may represent a leading indicator of a waning US equity market in the new year.

Click here for the current Market Tour.

Sunday, December 13, 2009

Bullish Stance Persists

Indices continue to trend upward (IWM has recently shown renewed strength). Market Breadth (NYMO, NYAD, etc.) are improving. A shift in the dollar/gold trends represent some risk to equities based on their inverse relationship since March 2009.

Friday, December 4, 2009

Cautiously Bullish

Strength in strong revenue-growth equities (typically captured in the IBD 100) and improvements in market breadth suggest continued opportunities to gain on the long side. The looming threat is resistance, which has been foreboding. One refreshing sign is the new high achieved by the Tranports, re-affirming a Dow Theory buy signal. Our strategy is to add strong stocks in basing patterns and to protect profits with trailing stops. We remain cautious, as a potential shift in the trend in Gold and the US Dollar bode potentially negative to equities, which have travelled inversely to these two asset classes.

Click here for our current Market Tour.

Thursday, December 3, 2009

Unemployment Report "Judgement Day"

A late day selloff, continued weakeness in market internals and deterioration in financials piled on the bearish omens. Most sectors however remain in uptrends. Rather than fight that trend, we will await the unemployment report on Friday and review the markets again following tomorrow's action.

Click here for today's Market Tour.

Wednesday, December 2, 2009

Recoveries from sell-offs are swift; weak sectors (IWM, XLF) continue to consolidate on a weekly basis, but have displayed some modest relative strength on a daily basis. Major price trend remains up and we will continue to participate in the uptrend with cautious stops set along the way.

Monday, November 23, 2009

Market internals are weakening

Weakeness in small caps, financials, and transports (which failed to reach a new high as the DOW achieved its new high) are cause for concern. Weekly charts have also begun to roll over.

Click here for the updated Market Tour.

Friday, November 13, 2009

Uptrend on weak footing; neutral stance

Market gains have been accompanied by weakening breadth and tentative volume. Relative underperformance in Financials and Small Caps (a flight to the safety of large caps), a declining trend in the McLellan Oscillator, and suggestions of a possible bottoming in the dollar, reinforce the weakeness of this uptrend. Although the trend remains up, the reward/risk ratio is unfavorable at these levels. We are focusing on large caps and mutual funds/ETF's with a more conservative bias, and hedging with partial shorts.

Take the Stockcharts.com Market Tour

Monday, November 9, 2009

Market extending for further gains

Positive breadth, improving volume on the upside and seasonal strength are providing fuel for further gains. SPX target of 1200 remains in play.

Click here for the latest update on Stockcharts.com

Saturday, October 31, 2009

Trend shifts to down; sell-off extremes hint at bounce

The trend has shifted down in most markets; both Nasdaq and SPX are closing in on point and figure sell signals following their prices falling below EMA 34. Small Caps have been correcting (and leading the trend change).

Advance-decline ratios have plummeted to the point where, in the past, a short-term low has been made. Reviewing past extremes of the McClellan Oscillator, a 3-4% bounce in equities would not be uncommon. Stocks over their 50-day moving average (especially the Nasdaq) have dropped precipitously and are ready for a bounce. The Put/Call close at 1.21 has signaled short-term bottoms before. While these are elements that can contribute to the trend change to down, they bode watching for signs of short-term extremes as precursors for a bounce (isn't November a typically strong month for stocks)?

Click here for the updated Market Tour on Stockcharts.com.

Wednesday, October 28, 2009

Trend remains up but breaks hint at continued retracement

In reviewing our Market Tour on Stockcharts.com, it has become evident that major indices are testing EMA 34 support (our preferred intermediate-term moving average) and breadth is declining to levels where SPX and Nasdaq retracements have ended. While jittery traders (and investors) take the opportunity to lock in profits, we plan to add to longs following some further shake-out in the equity markets over the very near term.

Tuesday, October 20, 2009

Caution for Longs

Continued deterioration in market breadth (as emphasized with a downtrend since early Oct in the McClellan Oscillator), widespread signs of divergence, an extremely oversold VIX and weak volume on equity gains have raised our caution level. We will refrain from adding longs, take some profits and set tighter stops.

Click here for Market Tour on Stockcharts.com

Saturday, October 10, 2009

Rally continues; volume weak but breadth strong

The rally is broad and a firm uptrend continues. We will continue to add basing positions in strong relative strength stocks.


Saturday, October 3, 2009

Potential trend change in progress

Caution continues to be advised. Stops have been tightened, profits on longs taken, and short hedges established. Market breadth has weakened significantly; transports have led the Dow lower (weakening the Dow Theory buy signal established in July), and initial bear market rally targets have been met.


Visit our Market Tour on Stockcharts.com. Red is bearish, Green Bullish and Black neutral. Note most market observations are red (bearish).


Tuesday, September 29, 2009

Caution at these levels

Setting tighter stops and refraining from adding longs. The rally is in its very late stage. We will hold off hedging with short positions but simply tighten stops. VIX appears to be forming a double bottom; transports are diverging from the Dow's uptrend, and defensives are gaining. While we could see more money enter the market due to seasonal factors, we would rather play it safe.

Click here for the Market Tour

Sunday, September 27, 2009

Healthy correction so far

Some positive breadth divergences as the major indices correct, coupled with modest volume on the selling, suggest that recent declines are part of a normal corrective pattern and do not comprise a major trend change. Our plan is to identify strong basing stocks with a plan to enter long once the selling finds support.

Click here for the current market tour.

Thursday, September 24, 2009

Neutral market position while potential correction ensues. We believe the risk/reward favors an eventual resumption of the uptrend into year-end. Market Breadth deteriorated swiftly with the 9/23 reversal. Trend remains up, and a consolidation was much needed.

Friday, September 18, 2009

Targets for SPX, DOW and Nasdaq

Targets are based on Elliott Wave structure, resistance and Fibonacci retracements. We anticipate the rally to continue with a short pause/consolidation likely in the near term. As the indices approach these targets, we will sell covered calls and reduce longs. We will go short on price confirmation of a change in trend.


Overbought for how long?


There are many more technical analysts out there today than at the last bear market bottom. Many anticipating a retracement of the bear market rally (as it has achieved initial targets) have also cited potential seasonal weakeness to support a pull-back (as well as divergences). As major indices are now just entering overbought levels on a daily basis, we may hear that "overbought" can remain for a long time, so don't short "overbought." As Martin Pring frequently states, "an actual buy or sell signal can come only when the price series itself gives a trend reversal signal."


Our strategy is to remain long, add to basing stocks, take some profits and set stops. We expect that we will leave money on the table when this market corrects, and will not pick a top (or bottom).

Click here for current market tour.

Thursday, September 17, 2009

Dow Target

Our initial upside target on the Dow is 10,000-11,000, with a secondary target of 12,300.


Sunday, September 13, 2009

Uptrend strengthens; transports break out; financials continue to base

Breadth on the uptrend has strengthened. Transports have broken out to the upside, breaking through rectangle resistance and confirming the new high in the Dow. VIX shows signs of bottoming (VIX formed a hammer on Friday), as the fear factor may creep in during Sep-Oct.


Financials were an early relative strength leader following the March bottom. They consolidated that lead in mid-May, then resumed leadership in late July. They have been consolidating again.


Click here for the latest Market Tour on Stockcharts.com


Thursday, September 10, 2009

Uptrend gains support; Nasdaq forms a new 2009 high


Nasdaq outperformance (vs. SPX) resumed in late August; breadth moving averages have turned positive as the indices forge higher. Financials continue to diverge (underperform) and RSI pickup on SPX and Nasdaq has been weaker than the price action on the indices. Regardless, the rally continues to have legs; strong stocks will be added on modest pullbacks.


Monday, September 7, 2009

Staples ready to outperform Discretionaries?


Reviewing the weekly chart of Staples vs. Discretionaries (see chart), the relative underperformance of Staples has gotten quite oversold. Its retracement from 2008 gains hit a Fibonacci 38.2% pullback, CCI and stochastics have formed higher lows, bouncing from oversold levels. Reward-Risk may favor Staples vs. Discretionaries in the short-term.


Sunday, September 6, 2009

Mixed Signals


SPX remains above support, Nasdaq improves (and outperformance resumes), both on weaker volume. VIX deflects from resistance and continues to form a base. Financials start to underperform. Indices have hit inital bear market rally targets, so caution is advised as one wonders how much reward there is vs. risk at this juncture.


An interesting find: in reviewing our Dow Theory we noticed that transports have been forming a potential rectangle top, suggesting an upside breakout in the continuation of its uptrend. This may be corresponding to recently lower oil prices, although since the March bottom, transports have been moving more in line with economic recovery signals rather than changes in crude pricing.


We are cautiously bullish based on the past price action since July: the market tends to form mild consolidations during its uptrend; increased seasonal trading activity will be key to clarifying the short-term directions.

Click here for the current Market Tour

Thursday, September 3, 2009

Market stalls; Unemployment report looms


No significant shifts in market perspective following Thursday's activity. Price and indicators are generally pointing to weakeness in equities. Strength in bonds, coupled with weakeness in small caps and financials and improved relative strength in staples, all suggest caution regarding equities.


Tuesday, September 1, 2009

Correction underway; targets assessed


Deteriorating technical action (see our recent posts) manifested itself into a correction. At this time price does not confirm a new downtrend (only a correction to watch carefully). 980 on SPX and 1930 on Nasdaq are keey support levels to watch. As the potential that the recent decline is a correction and the uptrend is sustained, we will be seeking stong, basing stocks to add once the dust clears.

Current Market Tour


The Dollar looks particularly interesting at this juncture. Long Dollar, Short Commodities may be the current high reward-risk trade.


Sunday, August 30, 2009

Technical footing of the rally weakens

Nasdaq started the day on Friday strong but settled for a modest gain. Negative signals include waning advance-decline statistics (McClellan Oscillator on the NYSE has turned negative) as the rally becomes more selective. The rally has also achieved initial rally targets per Elliott Wave analysis. Firming in bonds and the Dollar may suggest a change in trend for equities. Caution is advised unless and until equities can show a high-volume break from their consolidating pattern.

Click here for the current Market Tour.

Friday, August 28, 2009

Volatility rises; initial bear market rally target hit; divergence points to a setback

We believe that the reward-risk of being long equities is unfavorable. We plan to set tighter stops on remaining longs and wade into short positions. More to come......

Wednesday, August 26, 2009

Uptrend continues while negative divergence builds

Uptrend targets remain in force as market digests recent gains. Signs of negative divergence in RSI of indices as well as market breadth are concerning and need to be watched.

Market Tour Update on Stockcharts.com

Monday, August 24, 2009

Weekend Update


SPX target set 1150-1200; as technical market expectations have beat on the upside, it wouldn't be surprising to see 1300 hit on SPX within the next 4-6 weeks. Strategy is to add strong stocks on small pullbacks and to wade into index ETF's.


Thursday, August 20, 2009

Resumption of rally

Our Market Tour on Stockcharts.com depicts bullish, bearish and neutral signals in green, red and black, respectively. Most signals today are green (bullish). Although the rally from the March lows has come a long way, we have routinely viewed SPX 1100-1200 as the target.

Bullish signals include an improvement in market breadth (advance deline and McClellan Oscillators moving positive), improved price relative of XLF (financials), RSI of the major indices bouncing above 50, maintaining its bullish range (40 on the low side, 80 on the high), OBV confirmation on the uptrend, and VIX RSI falling below 50. Put/Call ratio turned a bit bearish below 75 today, but this indicator was overwhelmed by the positive signals.

Today we added basing stocks from IBD100 and other strong relative strength stocks that settled down over the last week. Shorts were covered (for minor losses) and a new position in QLD was taken.

Click here for current Market Tour

Selective longs for a selective rally?

The indices turned oversold fairly quickly during this recent correction. In reviewing strong performers (since the March lows), several have formed solid bases and retracement patterns that suggest possible setups for further gains. Market breadth has been declining steadily as the indices have risen, suggesting that stock picking may be the best way to participate in further gains. The rally is tiring, however, so we will remain selective, set appropriate stops, and maintain some short hedges on indices.

Tuesday, August 18, 2009

Tuesday Update: An Aging Rally


Market Position: Neutral-Bearish


Tuesday's modest recovery (on light volume) from Monday's sell-off suggest either a pause in the correction (with more to follow) or the completion of a minor retracement that will precede new highs. Wednesday will be key to assessing the next short-term moves. Positives include RSI(14) bouncing above the 50-line (SPX and Nasdaq) and VIX deflecting from resistance near 27.50. Negatives are the light volume on today's bounce, the weak trend in market breadth (and divergences we have seen since the beginning of August), and resurgent strength in staples (at the expense of consumer discretionaries).


Saturday, August 15, 2009

Weekend Update


Current Position: Neutral-Bearish


We believe that further gains are limited at this point. Some decent basing patterns are appearing in IBD 100 stocks, however we feel that higher reward-risk is seen (vs. being long equities) in the following trades:


  1. Long US Dollar (UUP).

  2. Short gold (GLD).

  3. Short FXA (Australian Dollar)

  4. Long TLT or LQD (treasuries and corporate bonds).

  5. We have initiated partial positions in short equities (QID, DXD, SDS).

Concerns with being long equities include:


  1. McClellan Oscillator turning negative for the first time since the start of this rally in early July

  2. NYSE Advance-decline EMA 5 dropping to negative

  3. Relative weakeness in Nasdaq, where its Advance-Decline has also turned negative and the 2000 level represents tough resistance

  4. The firming of the dollar

  5. Weakeness in consumer discretionary stocks

Click here for our latest Market Tour on Stockharts.com.


Wednesday, August 12, 2009

Neutral stance preferred


Short-term: Neutral


Momentum continues to suggest a consolidation. Breadth has been deteriorating on the NYSE and the Nasdaq as the market climbs. Recent outperformance of value vs. growth may point to increased risk-aversion, considering the strength of the rally since March. Financials have shown relative outperformance (a positive), while Technology has shows relative weakeness (a negative). A consolidation (rather than a correction) is more likely, with further gains ahead. This rally is aging, however, and profit-taking (as well as stop-tightening) may be prudent. For Dow Theorists, both the Dow and Transports have confirmed a new 2009 high.


Sunday, August 2, 2009

Retracement expected


Market Position: Neutral-Bearish


A pause in the rally is expected; SPX target is 940-960 (close 987), Nasdaq target is 1900-1940 (close 1979), for a 4-5% correction. Bear market rally targets remain at SPX 1100-1200 and Nasdaq 2050-2100.


Tuesday, July 28, 2009

Tuesday Update: Uptrend ready to pause


Short-term: Neutral
Click here for Market Tour

SPX formed a hanging man at its high today as it works through a sideways consolidation. Advance-Decline data has weakened (for both SPX and Nasdaq) but remain positive. A firming dollar threatens to move contrary to equities, where firming bond prices also point to a modest rotation from equities. Any correction is considered a 4th wave of a 5-wave uptrend and should be mild. A 1-3% retracement from current levels would convince us to add index longs. We will continue to scan for high reward-risk entry points in strong relative strength stocks.


Sunday, July 26, 2009

Weekend Update


Market Position:


Short-term: Neutral

Medium Term: Bullish

Long Term: Bearish


SPX remains firmly bullish as RSI breaks into overbought levels above 70 (where it can remain while an uptend continues). Both the DOW and Transports are in an uptrend (however the DOW has breached its 2009 high but the Transports have not). Price relative of financials has weakened as other sectors (paricularly healthcare and utilities) take up leadership. This is a bit of a concern and a potential early sign of sector rotation into defensives. Consumer Discretionaries took a hit on Friday as Staples bounced.


Nasdaq is showing signs of weakeness; its price relative to SPX is waning, its advance-decline line backed off from overbought resistance, and the steepness of its short-term uptrend slope begs for sideways action. Stocks above their 50-day moving average have bumped up against overbought resistance.


Strategy: enter new longs (and add to existing long positions) on a pullback. Raise stops and take partial profits on winners.


Thursday, July 23, 2009

Uptrend builds strength

Market position: Bullish

SPX had butted up against resistance near 940 three times this year, finally breaking through on strong volume today. Market breadth and sector participation on the upside is strong. Dow Theory confirmation was "further" confirmed today with new recovery highs in both indices. We plan to add long positions in basing, strong relative strength equities and cost-average into the indices.

Click here for charts


Tuesday, July 21, 2009

Uptrend continues; Upside participation thins out; Dow Theory Confirmation

Neutral
Click here for charts

SPX broke through resistance near 950 today; next support near 925. Advance-Decline ratio for both NYSE and Nasdaq have weakened during the last few days; the rally may become a stock-picker's rally for a while as recent gains consolidate. Another reason for a consolidation of recent gains is the behavior of the dollar, The dollar may have formed a bottom (today's doji possibly marks the end of a 5-wave downtrend). As the dollar has moved inversely to stocks, we may see a bounce in the dollar correspond with a decline in stocks.


As for Dow Theory, a recovery high in the Dow corresponded with the Transportation Index meeting its recover high, very close to a confirming signal on the upside.

Saturday, July 18, 2009

Proceed with caution: the uptrend's mixed signals


Market Position: Neutral-Bullish.


While we cannot ignore the strong price action as the market breaks to the upside, we cannot ignore technical signals that point to caution. SPX is bouncing up against resistance (for a 3rd time) since its January 2009 high. Each break upward since March has been on lighter volume (part of which can be attributed to lower seasonal activity). The Put/Call ratio at .74 is nearing the low levels where market pullbacks have occurred. VIX (albeit bullishly low) has gapped below its EMA to an extreme. Also, the Nasdaq has incurred a few too many "gaps up,"and financials relative strength (after a few strong days) has flattened again.


Out strategy is to add to longs on a pullback (3-5%) in SPX and in strong relative strength stocks.


Thursday, July 16, 2009

Thursday Update

The uptrend continues. We will hold off adding to longs without a modest pullback; focus on momentum stocks (i.e. IBD 100) with basing patterns and modest retracements. Those coming late to the rally might consider a short hedge.

See our latest update on Stockcharts.com.

Wednesday, July 15, 2009

Uptrend Resumes


Market Position: Bullish

Subtle signs of an oversold market and potential turnaround, as noted in this blog this week, manifested themselves into a breadth-intensive rally. With bumps along the way, we expect the market to hit new 2009 highs. Out SPX target is 1100-1200 in this countertrend (bear market) rally.

Tuesday, July 14, 2009

Tuesday Update


Market position: Neutral.


The subtle signs of an oversold market which were referred to last time, have enabled a change in the current downtrend from a possible significant correction (i.e. SPX to 800-840) to a minor retracement of recent gains (SPX 880). From a technical standpont, it appears that SPX and other indices are forming a flag (downtrending trading range) as a pause in the rally from the March lows. We are currently neutral, as it will take a breakout (either way) to turn firmly bullish or bearish.


Monday, July 13, 2009

Semiconductor relative strength


Note the chart below showing the relative performance of the Taiwan ETF (iShares) vs. EPP (MSCI Pacific ex-Japan), as well as the SMH vs. SPX. Taiwan is comprised of a relatively large market cap of semiconductor shares. Recent relative strength of Taiwan (since mid-June) and consistent strength of SMH (which has held up well during this recent correction) is a sign of internal market strength in technology and a positive leading indicator of an eventual recovery.

Sunday, July 12, 2009

Dollar moving closer to a bullish breakout


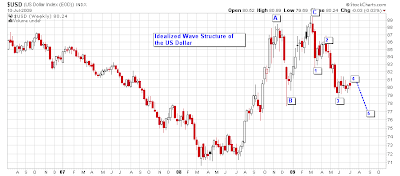
Although the US Dollar has firmed recently, we believe it is in a Wave 4 of a 5-wave downleg. Once completed, we expect the dollar to uptrend with a target in the mid-upper 80's (Friday's close was 80.24).

Dow Theory Update


Dow Theory looks for consistent price behavior in the Dow Jones Industrial Average and the Dow Jones Transportation Average. One should confirm the other (i.e. if the DJI hits a new high, the DJT is expected to follow closely). In early June, the DJI hit a recovery high (from the March lows) while the DJT hit a double top. The DJT's inability to hit a new high was a Dow Theory non-confirmation Since that time, both indices have been falling (now they are confirming the current downtrend).


Saturday, July 11, 2009

Weekend Update


Summary: Neutral-Bearish


Subtle signs of an oversold market have emerged as the major indices continue to trend lower. Much attention has focused on head and shoulders topping patterns in DIA and SPY; lower highs and declining relative strength underscore the downtrend. Put/Call 5-day EMA has closed above 1.0. Commodities have firmed (albeit for a couple of days, although their 50% correction of gains from March could suggest a favorable risk/reward for longs) as the dollar weakens. Oversold readings in stocks over their 50-day moving averages are a contrary positive. Our initial downside target in SPX is anothr 5-6% loss (to the 840-850 area). We believe the uptrend will continue once such support is reached.


Friday, July 10, 2009

Thursday Update

Major indices continue to trend lower. Much attention has focused on head and shoulders topping patterns in DIA and SPY; lower highs and declining relative strength underscore the downtrend. Put/Call 5-day EMA has closed above 1.0, however, the P/C reading is not at an overbought extreme (which could build confidence in a bounce). Commodities have firmed (albeit for a couple of days, although their 50% correction of gains from March could suggest a favorable risk/reward for longs) as the dollar weakens.

Wednesday, July 8, 2009

Tuesday Update


Market correction continues as major indices break support. A breakout of VIX above its downtrend line and Dow Theory non-confirmation (INDU and Transports), as well as weakening market brreadth, contributed to the corrective equity picture. We anticipate a buying opportunity following SPX correction to the 800-840 level.


Saturday, July 4, 2009

Weekend Update


The equity markets are currently undergoing a correction which we expect will offer buying opportunities in the months ahead.

Visit out Market Tour on Stockcharts.com.


Consumer Staples Taking the Lead


In late February, consumer discretionary stocks took the relative strength lead vs. SPX, as consumer staples lagged. In May, however, that relationship has reversed, underscoring a more cautious market.


Thursday, July 2, 2009

Potential Wave Structure: SPX


Here is our hypothetical wave structure for SPX. SPX completed Primary Wave 1 downtrend in March 2009. Primary Wave 2 countertrend rally will likely break into 3 waves, the first of which (A) has completed. We are currently in Wave B of Primary Wave 2.


Wednesday, July 1, 2009

Select sector ETF's have been breaking down

XLB (materials) weakening; similar setups can be seen in XLF and XHB. Click on the chart for a larger view.


Tuesday, June 30, 2009

Tuesday Update

The period of consolidation/trading range appears to be on weaker footing than strength. In particular, weakness in market breadth and advance/decline volume (as manifested in the McClellan Oscillator and its Summation Index) are troubling. Continued underperformance of financials and topping out in commodities provide additional signals that this rally needs a breather or a correction.

We are refraining from adding longs, continuing to sell covered and uncovered calls, and shorting select sectors. Oil (USO) appears to be topping out.

Unemployment Rate vs. S&P 500

Reprint of analysis completed in Q3 2008 forecasting the March 2009 bottom in the S&P500 and estimated timeline to recovery.

Click here for the report.

Saturday, June 27, 2009

Weekend Update

Short-term, the odds favor a continuation of the uptrend. Major support holds for SPX and Nasdaq as the market bounces from an oversold condition. VIX failed its recent upward breakout as it drops below support. A move in VIX like this tends to presage continued market strength, although we need to be mindful of VIX getting too oversold (measured by the gap from its 50-day EMA). Nasdaq has once again outperformed SPX (a positive sign). Market breadth has been improving. Continued relative weakeness in financials and strength in durables are cause for concern for equities. Recent strength in the dollar seems to be waning, although commodities are weakening too. No major inflationary concerns are anticipated in the intermediate term.

Neutral-Bullish short-term; Bearish intermediate term.

Tuesday, June 23, 2009

Market Tour Update

Several indicators point toward continued weakness or continued sideways price action in equities. Breadth has continued to deteriorate and is not yet oversold (although the McClellan Oscilator is getting close), VIX wants to form a firm bottom near 30, and our simple Dow Theory non-confirmation continues (see our Market Tour on Stockcharts.com). Financial stocks have continued to underperform the averages, and Nasdaq has also begun to underperform as defensives (healthcare, staples) outperform. There are simply more negatives than positives at this time.

Visit Baseline Analytics' Market Tour on Stockcharts.com. Note that commentary and line studies use the following codes: green (bullish); red (bearish); black (neutral). Updated Tuesdays, Thursdays and on Weekends.

Sunday, June 21, 2009

Weekend Update

The equity markets sit at an important juncture. Consolidation of recent gains have exhibited signs of divergence and deteriorating market breadth. Is it merely the summer doldrums or (as the Wave Theorists would argue) an impending correction? Since we don't trade in anticipation of a trend change (preferring instead to see price confirmation of a trend change), we will remain cautious. Longs have been hedged with covered calls and appropriate stops, and some index shorts (for an overall neutral stance). We will refrain from adding longs except for high-volume break-outs (select healthcare/pharmaceutical issues have shown recent signs of strength).

See our latest charts on Stockcharts.com

Saturday, June 20, 2009

Current Market Tour

This bear market rally has a little more un-winding to complete before a potential short-term base is formed. Extreme overbought readings (especially stocks above their 50-day moving averages) require some time to settle back. Waning momentum, signs of divergence including Dow Theory non-confirmation provided clues to this retracement. We have been short SPY, QQQQ, RTH, long Dollar and FXY, and have sold calls on extended stocks. Staples and healthcare have shown strong basing and some breakouts. Volume on the downside has not been extreme, a positive sign. At this time (subject to change), we expect an orderly correction of the uptrend rather than a retest of the March lows.

Link to Market Tour on Stockcharts.com


Updated 06/18/09 market close.

COMMENTS AND SYMBOLS GUIDE: GREEN BULLISH, RED BEARISH, BLACK NEUTRAL.

Additional research at www.baselineanalytics.com.