Sunday, February 27, 2011

Putting the "sell-off" in perspective

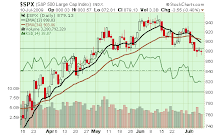
Viewed from the perspective of the 26% gain in the S&P500 since September, last week's 1.7% decline in the S&P500 did very little to dent the uptrend. Volume on the decline was modest and compared similarly to the volume on a short bout of selling in late January.  The worst of the decline also compares to the decline experienced in November. So as declines go, the current Mideast tumult was no different than the two prior declines.  See the chart below:


One indicator we watch is S&P500 stocks trading over their 50-day moving average. As expected, this indicator dropped but found support at levels of the November setback, indicating no major damage at this time.

Dow Theory is a bit precarious as the Transports took a larger hit than Industrials last week as the price of oil surged. The index settled at support near 5,000 at its late January lows. A close below support would constitute an intermediate-term downtrend and a red flag.  See the chart below:


Last week's selling in equities attracted a bid to Treasuries, as the 30-year Treasury Bond price bounced over 2% on the week. Other than this unsurprising reaction to the decline in equities, all other indicators remained positive for equities despite modest pullbacks as their main trends remained unchanged.

Some of our trailing stop hedges on the uptrend were executed last week.  While we continue to maintain stops on our long positions, we added some new longs as the market sold off, anticipating a potential "buy on the dip" as buying pressure nonetheless remains intact (we saw a nice bounce on Friday).  With a weakening dollar and outperformance of small caps, we find the large cap universe increasingly interesting.  Also interesting is emerging market equities, having sold off over the last several months.

Click here for the updated Market Tour on StockCharts.com.

Sunday, February 20, 2011

Joining the Crowd

As more bullish equity enthusiasts join the uptrend, equities are increasingly vulnerable to a shock that, by all indicators, will be addressed with "buying on the dip."  The buying pressure in equities continues to track with the persistent growth in bullishness among investment advisors. Our trend-following indicators flash green throughout. Some noteworthy trends:

Small caps and growth continue to outpace large caps and value. After hitting trendline support in early January, the ratio of small vs. large cap continues to shine, following a steady uptrend since the bottom in March 2009. We are watchful for a peak in this outperformance leading any peak in the S&P500. The small cap/large cap ratio last peaked about 18 months before the peak in SPX:


US equities maintain their relative strength lead vs. emerging markets, a lead which formed in November 2010.  Bubble talk of China real estate, geopolitical risk and rising inflation and monetary tightening in emerging markets have encouraged outflows into developed market equities.  This might present an opportunity for selective investment in certain emerging markets vs. others. Technically, Malasia (ETF symbol EWM),  Indonesia (ETF symbol IDX) and South Africa (ETF symbol EZA) have seen some impressive bounces. This contrasts with MES (The Gulf States ETF) as one can expect has lagged emerging markets due to continued political unrest:


As for other positive signs for equities, Dow Theory remains consistently bullish as the Transports reached a new recovery high, following the lead of the Dow Industrials.  Strong relative strength growth in Corporate Bonds vs. Treasuries, a measure of risk appetite and preference for stocks, also continues. We added a relative strength ratio of LQD (the iShares iBoxx Investment Grade Corporate bond ETF) vs. S&P500 at the bottom of the chart (below). Note the price crossing its 34-day moving average indicating turns in preference of equities vs. bonds. This signal has been on an intermediate-term  "buy" on equities since September:


We continue to see lagging performance in the Nasdaq vs. the S&P500. This likely represents concentration in money flows into a broader mix of sectors (industrials, materials, financials) versus the tech-heavy index. We are a bit cautious toward putting too much credence in this relationship, however, as QQQQ, which is the ETF that holds the Nasdaq 100 stocks, is weighted 19.74% in Apple Computer and is therefore heavily influenced by this particular stock.  APPL has been lagging the SPX since mid-October 2010.

Our trend-following strategy keeps us positive on equities. We are very comforatble with partial hedges on these longs, however, with index puts on SPX and trailing stops to protect profits.

Click here for all of the charts in our Market Tour on StockCharts.com.

Sunday, February 13, 2011

More positive indicators support the uptrend; time to be cautious?

Equities appears to be running on all cylinders, as most indicators remain positively bullish.

Our Dow Theory indicator has turned more positive as Transports surged last week and remain 4% off their 2008 high. We like to see the Dow Industrials and Transports move consistently to lend support to the uptrend. See the chart below:


VIX remains low at 15.7, matching the lows reached in late 2007 through May 2008 (and, more recently, April 2010). Low volatility has introduced bargain prices on options; those seeking protection can purchase cheap puts, while those joining the bullish camp can find inexpensive calls (many in-the-money calls sell for barely any premium over intrinsic value). The gap in VIX price vs. its moving average, once again, is wide enough to suggest that a bit of caution is warranted for equity bulls. See below:


Our NYSE McClellan Oscillator closed positive on all counts last week, underscoring strength in advances vs. declines and the broad participation of most equities in this uptrend. See the chart below:


At this stage of the rally, one would expect laggards to start catching a bid. One such laggard has been the Staples sector, and there is no sign of catch-up from this group. Staples have been lagging Discretionaries, and this relationship was pronounced last week as the latter sector surged above its 16-day moving average and handily beat the sluggish Staples sector (food commodity inflation may be taking some toll on the group):


Underscoring the strength in the "risk-on" trade is the performance of our US Treasury/Copper Futures ratio,  This ratio broke out to a new high (breaking resistance hit in 2006, 2007 and 2008). The COPPER/USB ratio underscores inflationary pressures. A rising Copper (or CRB) denotes inflation, while declining bonds (and corresponding higher interest rates) also support inflationary tendencies.  The COPPER/USB ratio does a fine job confirming the trend in the equity markets (see the chart below with SPX plotted at the bottom):


Asian equities continue to take the heat and lag US equities. Tightening monetary policy through rising interest rates in many Asian countries is inducing fund outflows which are finding their way back into the US. Our EPP/SPX ratio (the iShares MSCI Pacific ex-Japan index vs. the S&P500) broke trendline support this week (as the dollar strengthened too), underscoring a shift in sentiment toward the US. See the chart below:


Prices of 30-year US Treasuries rose slightly on the week but continue to linger near a support shelf near 115. Testing support will be key and we will watch this behavior for signs of a reversal (and potential coincident decline in equities). At these levels, some allocation back into bonds may be a prudent move:


Other indicators remain positive. Our Corporate Bond/US Treasury ratio continues to support the uptrend in equities. Small Caps outperformed Large Caps, and Growth outperformed Value. Signs of these relationships changing will indicate an improvement in lagging sectors and will underscore an aging uptrend in equities.

Even in the historically weak month of February, dips appears to be bought as buying pressure remains. It is under these conditions that a surprise selloff triggered often by some unsuspecting event catches us off-guard.  With options prices remaining inexpensive, it may be wise to protect one's equity portfolio with an index-based put (i.e. one-month SPY puts) as insurance.

Click here for all of the charts in our Market Tour on StockCharts.com.

Sunday, February 6, 2011

Market Tour Update

Equities push toward recovery highs, yet subtle signs of an aging bull continue to fester in our market indicators.  

On the positive side, one indicator we watch is the relationship between copper prices and the 30-year Treasury price. This serves as an indicator of economic growth expectations. As the price of copper (a proxy for industrial metals and hence economic growth) rises, and the price of treasuries falls (rates rise), bullish expectations toward economic expansion prevails. This ratio (Copper Vs. $USB) broke through resistance this week as marked by peaks seen in 2006, 2007 and 2008, and is a solid reinforcement of the uptrend in equities.  See the chart below:


The CRB likewise has seen strength in industrial metals and agriculture (manifested in global price increases for food), despite the weakness in Gold prices as the "risk-on" trade (favoring equities) has re-emerged.

We also saw a surge in our LQD (corporate bond price) Vs. IEF (intermediate-term Treasury bond price) ratio. Historically, a flat to rising trend in this ratio has been positive for stocks.  See the chart below:


Pacific markets have outperformed US equities since April 2010, but have given up that performance since Q4 2010. Although money has been flowing out of emerging markets (and bond funds) and into US equities, we believe this outflow has been overdone; our ratio of EPP (MSCI Pacific ex-Japan ETF) vs. the S&P 500 has found support off a rising trendline formed since early 2009.   See the chart below:


On the downside, once again VIX has turned complacent, falling from its spike to 20 back down to below 16. For the Bulls out there, this would suggest cheap call options to participate in the rally. Another negative is the continuation of Dow theory divergence, as the Dow Jones Industrial Average closes in toward its recover high while the Dow Jones Transports lag (and fall). Airlines have been particularly weak, as rising oil prices may be taking its toll on the index. See the chart below:


Asset allocations out of bonds (and emerging markets) into US equities have helped to extend the current rally.  February tends to be a weak month for equities, however, so we will position our expectations on the cautious side to protect our equity gains.

Click here for all charts in our Market Tour on StockCharts.com.

Sunday, January 30, 2011

Overdue correction needs time to resolve

A relatively sharp decline in global indices (the much-needed respite we have spoken about in this blog, triggered by events in the Middle East) needs some time to find its footing before our trend-following strategies are re-engaged to follow the uptrend.

Nasdaq took the brunt of the selling this week; this was clearly seen in the percentage of stock remaining over their 50-day moving average, which sharply dropped below their low seen during the correction in November.  In addition, Nasdaq relative strength, which has been weakening, saw a sharp drop on Friday. See the charts below:


VIX surged above its 50-day moving average.  A large gap in VIX below its 50-day moving average warned of a possible reversal (which transpired this week). Now, VIX rests well above its 50-day moving average; we will be watching this gauge as a possible clue to resumption of the uptrend:


A sharp decline in the LQD/IEF ratio, our spread of corporate bond prices vs. short-term Treasuries, is a concern worth noting. A flat or uptrending slope in this ratio has been favorable to equities. Although the trend remains up, this indicator warrants watching for a potential trend change.  See the chart below:


Although the uptrend in equities remains intact, we will be watching our indicators for stronger signs of a change in trend. Holding off on adding large long positions (partial entries may be warranted) and maintaining our stops.

Click here for the updated Market Tour on StockCharts.com.


Sunday, January 23, 2011

Nasdaq leads the decline; Dow Theory divergence and small cap weakness bear watching

As equities take their first noticeable breather since mid-November, it is noteworthy to observe the relative weakness in the Nasdaq compared with the S&P500. The Nasdaq's swift correction in relative strength (the composite fell 2.39% on the week vs. .76% for SPX) is its most extreme since equities rallied off their September lows.  Some frothiness in technology and a few bad apples in the earnings mix proved enough to shake the bulls from their perch in this sector of the markets.  See the chart below:


Nasdaq breadth indicators swiftly fell to levels achieved at the lows in November. Stocks trading over their 50-day moving average fell over 10% to 70%, nearly matching the level seen at the bottom of the pullback in November's 5% rout.  Although this respite in bullish frothiness was needed, it was met with light volume, a positive reinforcement of the bullish uptrend and perhaps enough to entice some nibblers to buy.  See the chart below:


In fact, we focus on the Nasdaq and its relationship to its former high at 2,859 achieved on Halloween 2007. A decisive break of this high (another 6% to go) will reinforce the bullish trend and coerce other equity indices to follow along.

Moving on to other sectors and styles, we have found some curious changes that bear watching.

The Dow Jones Transportation Index took a hit this week, printing a divergence from the Down Jones Industrials. This is the first significant divergence in Dow Theory seen since the September bottom and bodes watching. There was no single culprit in the transportation index decline, spread across airlines, ground and maritime shipping.


As for style, this week we saw a noteworthy correction in the relative strength of small caps vs. large caps, a larger hit that the one we saw in November. This could be normal profit-taking in the frothier side of the market in favor of more conservative equities. Although the uptrend in small caps vs. large caps remains intact, watch for style rotation as the significant market gains from the March 2009 bottom begin to wear. Small cap outperformance peaked about 18 months before the S&P500 peaked in October 2007. This could suggest the need for large caps to "catch-up" to the performance of small caps before this Bull run is over. See the chart below:


Reviewing our sentiment readings, our Put/Call alert flashed last week came to fruition as the low seen had in the past preceded market declines.  See out chart below (from last week's blog):


Today, this indicator reads neutral-slightly bearish at .79.  VIX similarly printed an extreme reading last week and preceded the pullback as noted in this blog. Today, VIX crossed above its 50-day moving average, eliminating the "risk gap" we have noted before. Based on past market behavior, VIX could see some more upside (and equities some downside) before a modest "November-like" correction is over.

As the uptrend remains intact, we suggest holding off with new buys until some basing is seen. In the November correction, prices took a hit quickly then stabilized; in November, our indicators resolved themselves to the bullish camp rather quickly after the first few days of declining prices. Watching price and our indicators this week will play an important role in assessing the health of the Bull run.

Click here for the latest Market Tour on StockCharts.com.

Sunday, January 16, 2011

Market Tour Update

Bullish prices marched forward this week as negative divergences in momentum indicators resolved themselves through the price uptrend. Volume on the uptrend remained modest (it should have been much higher now that the holidays are behind us). Our sentiment indicators this week tried to convince the Bull to tame its advance, but the Bull just charged on with no sign of tripping over the extreme readings that our sentiment indicators continue to flash.

Two indicators currently stretched and signalling caution for longs include VIX (the Volatility Index) and the Put/Call ratio. The latter, in particular, is helpful in identifying price extremes.  For example, when investors and traders are excessively bullish, they will buy more calls vs. puts, therefore deflating the put/call ratio. The theory is that when "everyone" is buying and bullish, there are fewer investors left to keep the rising momentum going. Friday's Put/Call ratio of .58 was last seen on April 15, 2010, one day prior to a 2% pullback in SPX and the start of a11% retreat in the index through May. Timing, however, is tricky with this indicator, and the start of options expiration week this Monday could have skewed Friday's reading a bit.  But this is an indicator nonetheless to keep an eye on. See the chart below:


Our next indicator of note is VIX, which represents volatility in equities and trends lower as equity investors become complacent with a climbing uptrend and join the crowd. Our VIX indicator once again flashed a complacency warning sign; with the index falling significantly below its 50-day moving average (it closed Friday at 15.5). The last time such a gap was seen, the SPX embarked on a trading range with no significant pullback to speak of.  See the chart below:


VIX can remain "complacent" for a long time. VIX was at this current level in Q4 04 and continued to trend lower through Q1 07 (touching single digits at times) as the SPX marched upward into 2008. During this time frame, however, VIX would go through fits and starts just as equities did, as consolidations and single-digit corrections dotted the landscape.  It is interesting to note that at today;s VIX closing level, the indicator almost matches its low formed in April 2010 prior to the aforementioned correction.

Outside of these two indicators, the patient is healthy. At the end of the day, PRICE is the key indicator and that remains positive and yet extended (we track the delta between price and a few of its moving averages, a gap which has underscored the market's extension).  Market breadth remains strong.  As for resistance, note that the Nasdaq Composite is about 20 points away from meeting up with its 2007 high. Breaking through this resistance level will lend credibility to the prospect of a longer-term bull market.  US equities have begun to outpace Pacific-rim markets, and bonds continue to feel the effect of allocations shifting toward stocks.  Some emerging markets (i.e. India) are beginning to feel the heat of food price inflation, as several central banks have been raising interest rates, in part to cool QE2-induced cashflow from sparking bubbles in those emerging markets. We may be seeing the start of such a trend. We look at the Pacitic Rim markets (ex-Japan) and have noted their recent underperformance vs. SPX.  See the chart below:


As for sectors, Financials and Technology, two sectors we would like to see as leaders in the market, have resumed their relative strength uptrends. Small Caps continue to outshine large caps, and growth continues to beat value.

One of the most disconcerting decisions to make at this juncture is whether to continue to join the crowd and buy stocks. The big doubt in the back of one's mind is whether one is buying at a top. When uptrends gain significant momentum (think back at the 2003-2007 time frame), those who stayed the course, averaging into the market with partial buys along the way, and boosting long positions more aggressively in market pullbacks, were rewarded.

One needs to be mindful of the risks inherent in a strategy this time. Macro-economic conditions underscore the risk: The US is recovering at a slower pace today than it did following the 2001 recession largely due to the absence of growth from housing and stubbornly-high unemployment. The risk of national and local debt levels continue to hang over us as a dark cloud. And inflation seems to want to break out of its cage after being tame for so long (some food price indicators are harkening back to the leap in rice inflation in 2008). Oil price is another concern; will the price of gasoline pushing toward $4 per gallon trip this nascent recovery?  In late 2007, as West Texas Intermediate Crude surpassed $90 per barrel (where it sits today), the SPX started to stumble (most likely as mortgage fears surfaced, but perhaps in part spurred by the fear of $4.00 per gallon gasoline).  See the chart below:


As we keep abreast of the stage of the recovery and the economic cycle, we can't ignore those sectors that have underperformed and perhaps will "have their day." Consumer Staples, Healthcare, Financials and Utilities have underperformed as Materials, Energy, Technology and Consumer Discretionaries have led.  Will potential sector rotation (laggards turning into leaders) provide some guidance as a way to participate in the uptrend? Reviewing our relative strength indicators, Technology and Financials (noting their recent strength), tempered with some weightings in Consumer Staples and Healthcare (shunning Utilities due to interest rate risk) might be a prudent way to approach this market.

Click here for the Market tour on StockCharts.com.