Monday, August 6, 2012

Setting Stops Using Average True Range

Setting stops on portfolio positions is often a mixed blessing.  Often, a stop is activated and money is left on the table as the stock continues to rise. One approach is to incorporate volatility and the longer-term trend in determining the stop level or trailing stop threshold. 
The following stop-setting strategy can help an investor stay with the stock’s main trend for as long as possible.  This is an objective-based approach, rather than an approach prone to subjective opinion, enabling the investor to remain honest with himself and his capital.
We are utilizing ATR as a basis of setting stops.  ATR is “Average True Range,” and is calculated based on a stock’s volatility, incorporating recent highs vs. recent lows in a stock’s price.  In the chart below of Apple, the ATR varies approximately from a high of $38 to a low of $10. A simple, objective rule to follow is to use 2x the ATR. There is nothing scientific or “secret sauce” for using 2X other than avoiding daily volatility whipsaws. 
Assuming a buy point of $250 in September 2010 (first blue vertical line), the ATR at that point was $16.  $16 x 2 = $32 stop range, or a stop of $218.  As APPL continues its uptrend, the stop is adjusted at a point where the stock bases, near $325 a share.  At this point, the stop is set just under $300 per share.  This is a simple, mathematical approach that will help the investor avoid arguing with himself about where to set stops.

Similarly, this objective approach can be set with a trailing stop.  Use the same 2X ATR to set the trailing stop and simply let it ride.
We find that using weekly charts and their resulting ATR values are most useful is holding positions as long as possible to maximize gains during an uptrend.  Using ATR as a stop-setting mechanism is a sure way to avoid the trap of guessing when to get out of a position.
As for taking profits (and losses) a prudent strategy is to set such ATR-based stops, but also take random profits (or losses) now and then. An investor can, for example, use the ATR stop strategy on 70% of his portfolio, but apply a concerted profit or loss-taking strategy on the balance of the portfolio.  Markets trend, yet they can also be volatile and easily take away the capital gains that an investor has achieved.
Visit Baseline Analytics TrendFlex, our subscription-based service helping to keep investors on the right side of the market at all times.

Saturday, July 28, 2012

Stocks Are Remarkably Cheap By This Measure of Valuation

From an historical perspective spanning the last 55 years, the S&P500 is at a valuation level matching the lows experienced before the launch of the bullish stock market run that started in the early 1980’s and peaked in early 2000.  


To collect this data, I went to FRED, the Federal Reserve Economic Data maintained by the Federal Reserve of St. Louis. I plotted the S&P500 plus a plot of the index divided by seasonally-adjusted After Tax Corporate Profits to arrive at a proxy PE ratio.
 

As the chart below shows, although the S&P500 is 10% below its 2000 peak, valuations today are 71% lower than the valuations reached in 2000 (the blue line is the PE ratio and the red line is the S&P500 index). Note how the PE ratio is aligned with levels last seen in the early-mid 1980’s.  Compared to the 2007 peak, the S&P500 is 12% lower, yet valuations are cheaper by about 30%.


 This data raises a couple of immediate observations:


1.      Stocks are extraordinarily cheap. The significant earnings power that corporations have generated from secular economic trends in productivity and globalization has outpaced stock price growth. It would appear that stock prices need to catch up. At a minimum, it may suggest that stock prices are fairly well-protected on the downside, an opportunity for long-term investors. As historically low interest rates benefit corporations and consumers, as well as raise the risk of an asset bubble in fixed income investments, perhaps stocks are the screaming buy alternative. Many workers who entered the labor force in the early 1980’s (like me) saw stock portfolios rise consistently up to the 2000 peak. Perhaps today’s workforce entrants will experience a similar long-term ride.

2.      Investors are less willing to bid up stock prices commensurate with earnings growth.  This may suggest waning participation from retail investors or simply skepticism and fear that something terrible is about to happen (i.e. the implosion of the Eurozone). Perhaps these historically low valuations are suggesting that stock prices and the financial markets in general are preparing to collapse, warning of a deflationary environment and a market not unlike that experienced by Japan over a 20+ year span. The lack of enthusiasm to bid up prices as earnings grow may suggest a sea of bearishness as well as skepticism and outright contempt of the stock market. But that too feels like a long-term contrarian “buy” signal.


I then took the FRED data and decided to see how an interest rate-adjusted PE ratio compared historically to stock prices.   Since interest rates are so low, and the earning yield relative to interest rates is another popular valuation indicator, I chose to multiply the PE ratio by the Federal Funds Rate, which today is 0.25%, to see how this measure of valuation stacks up historically.


As you can see by the chart below, replacing the blue line in the above chart (our PE ratio) with a line modified by the Federal Funds Rate tells us that valuations are at their lowest in the 55-year history that the Federal Reserve has been collecting this data.


That suggests serious undervaluation of stocks. Such a dismal valuation is either a precursor to Armageddon in the financial markets, or a great secular buying opportunity.

Secular markets have historically lasted 10 to 15 years.  The market peak in 2000 has been popularly considered the start of a secular bear market that is now pushing 13 years in age.  Unless a market rout is in the cards to take this secular bear market to another significant decline to complete the bearish secular trend, today’s valuations suggest that a slow and steady buildup of a portfolio of equities may be a prudent long-term investment strategy, one that rewarded investors following the secular bear market of the 1970’s.

Saturday, July 14, 2012

NYSE Breadth Supports Uptrend

Three key market breadth indicators I follow include three views of NYSE activity:
  1. Advance/Decline ratio
  2. Up Volume vs. Down Volume
  3. New Highs vs. New Lows
The NYSE Advance/Decline ratio is the healthiest technically, while the other two ratios are behaving quite well. See the chart below:


The A/D Volume line looks to be pushing to a new intermediate-term high. I find the 63-day exponential moving average a useful gauge of support and resistance. A market breadth indicator such as this provides reassuring support for this upleg in the NYSE index.

Similarly, the NYUD and NYHL are heading in the right (bullish) direction after bottoming in late May.

Besides looking at price charts, measures of market breadth such as this are helpful indicators in assessing the strength of the trend.

More about the blend of technical indicators used by Baseline Analytics can be found here.

Wednesday, July 11, 2012

VIX and SPX: Using Moving Averages to Assess Trend

One simple indicator to catch the "right" side of the market is a comparison of the S&P500 daily chart with the VIX.  Both are plotted with a 34-day exponential moving average.

Note the chart below.  When VIX is below its 34-day EMA, the S&P500 is generally in an uptrend. When VIX is above its 34-day EMA, as it was starting in early May 2012 through mid-June, the S&P500 was falling.  This signal system will generate whipsaws and is not perfect in any sense.  But it represents yet another simple approach to identifying the major intermediate-term trend so that investors can remain on the "right" side of the market.  Click here to visit Baseline Analytics TrendFlex, which incorporates several indicators like that one below, to identify (and stick with) the major trend.

Sunday, July 8, 2012

Small Caps underperforming Large Caps

One indicator we use to assess the health of the stock market is a Small Cap vs. Large Cap ratio.  Small Caps peaked in April 2006 and underperformed Large Caps for two years, bottoming in January 2008. They then outperformed until October 2008, after which they headed straight south as the stock market bottomed in March 2009.  See below:


After the bottom in March 2009, Small Caps outperformed Large Caps until recently, peaking in May 2011.  They have generally underperformed since. 

Just as defensive issues have takes a lead on growth and discretionaries (see last week's blog), Small Caps (which tend to be associated with higher risk) have underperformed their larger, more defensive (and typically dividend-paying) brethren.  Be aware of this shift in market psychology when assessing market sectors and the stock market in general.

Click here for Baseline Analytics TrendFlex, our market trend timing indicator which encompasses a mix of technical and macro-economic factors to keep investors on the right side of the market.

Thursday, July 5, 2012

Staples Outperforming Discretionaries

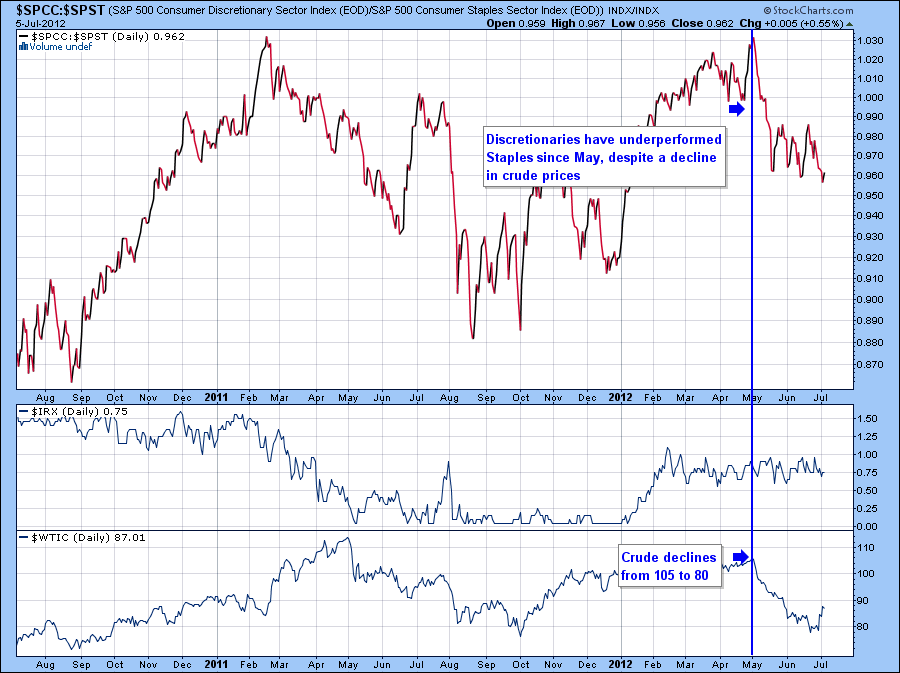
At the start of 2012, Discretionary stocks, as measured by the S&P500 Consumer Discretionary Index (SPCC) outperformed Staples, as measured by the S&P500 Consumer Staples Index (SPST). Curiously, since May, this relationship has reversed, with Staples outperforming Discretionaries. See the chart below.


The solid red line is the ratio of SPCC to SPST. Note the decline since May. It is interesting that this decline was accompanied by a decline in the price of crude (see the bottom of the chart), somewhat contrary to what one might expect.

This could signify an aging of the business cycle where more conservative equities tend to outperform. Although the "risk-on" trade seems to be the prevalent trade since early June, one might call this the "risk partially on" trade, noting the shift toward more defensive (and dividend-paying) equities.

Monday, July 2, 2012

Investment Rule #2: Don’t Get Ahead of Yourself

Most of us do not have the time to research, follow and hold more than 10-15 stocks at one time.  We inevitably get busy with other priorities and can easily lose track of performance and the vagaries of a company’s operating results.

Keeping track of too many positions frequently results in time lost doing more important leisurely activities. Give the randomness and often volatile character of the financial markets, micro-managing positions, setting and adjusting stops repeatedly and searching for new positions via software tools or newsletters, is extra worth that is likely not a good use of time (but is certainly likely to drive up transaction costs and cause whipsawed results). 

To build a respectable mix of diversified investments, consider strong companies each representing an industry “in favor” with the current economic trend.  Characteristics to look for include consistent revenue and earnings growth, historical bias to upside earnings surprises, return on equity of 10% or higher, growth at a reasonable price (i.e. a PEG ratio, or Price Earnings-to-Growth Ratio, of 1.5 or less), and positive cashflow. These are simple factors that help define a quality company at a reasonable price.

So when the Baseline Analytics TrendFlex score is in “BUY” mode, hopefully you have built a list of such companies and kept them in your back pocket for the trend to support establishing a long position.   Try not to hold more than 15 of such companies (10 would be better), and let them ride with the trend. 

Should the TrendFlex Score turn to sell, don’t necessarily abandon these winners. Consider hedging with futures, selling calls to collect option premiums, reduce your holdings or protect them with index puts.  All too often we have looked back at strong companies we sold too soon as they continued to move toward new highs.  Take a longer-term perspective with these winning companies, but hedge your market exposure with other methods in the meantime when the trend turns negative.

Visit Baseline Analytics TrendFlex for Investment Rule #1.