Sunday, July 8, 2012

Small Caps underperforming Large Caps

One indicator we use to assess the health of the stock market is a Small Cap vs. Large Cap ratio.  Small Caps peaked in April 2006 and underperformed Large Caps for two years, bottoming in January 2008. They then outperformed until October 2008, after which they headed straight south as the stock market bottomed in March 2009.  See below:


After the bottom in March 2009, Small Caps outperformed Large Caps until recently, peaking in May 2011.  They have generally underperformed since. 

Just as defensive issues have takes a lead on growth and discretionaries (see last week's blog), Small Caps (which tend to be associated with higher risk) have underperformed their larger, more defensive (and typically dividend-paying) brethren.  Be aware of this shift in market psychology when assessing market sectors and the stock market in general.

Click here for Baseline Analytics TrendFlex, our market trend timing indicator which encompasses a mix of technical and macro-economic factors to keep investors on the right side of the market.

Thursday, July 5, 2012

Staples Outperforming Discretionaries

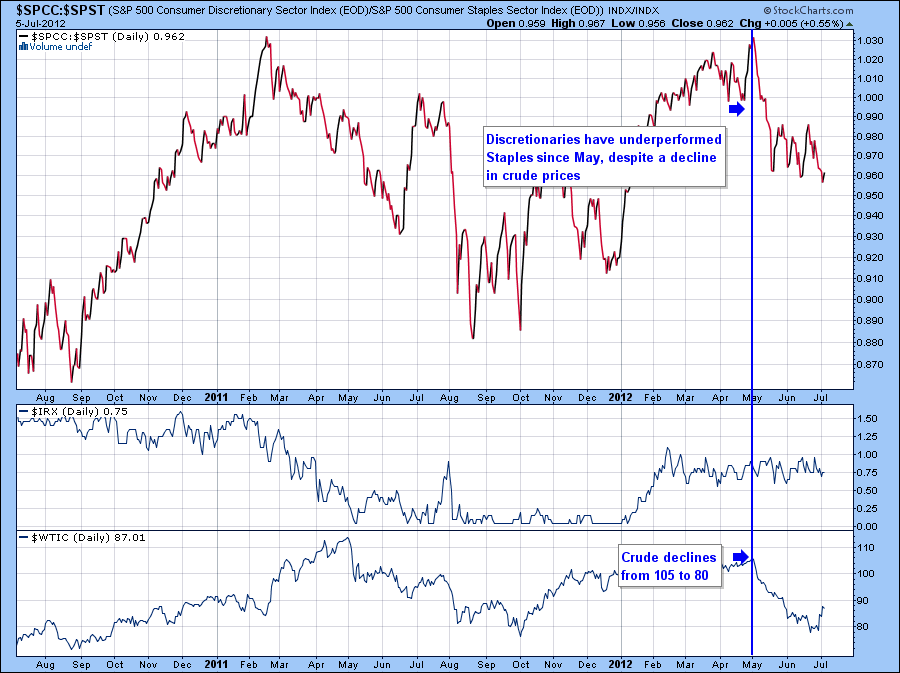
At the start of 2012, Discretionary stocks, as measured by the S&P500 Consumer Discretionary Index (SPCC) outperformed Staples, as measured by the S&P500 Consumer Staples Index (SPST). Curiously, since May, this relationship has reversed, with Staples outperforming Discretionaries. See the chart below.


The solid red line is the ratio of SPCC to SPST. Note the decline since May. It is interesting that this decline was accompanied by a decline in the price of crude (see the bottom of the chart), somewhat contrary to what one might expect.

This could signify an aging of the business cycle where more conservative equities tend to outperform. Although the "risk-on" trade seems to be the prevalent trade since early June, one might call this the "risk partially on" trade, noting the shift toward more defensive (and dividend-paying) equities.

Monday, July 2, 2012

Investment Rule #2: Don’t Get Ahead of Yourself

Most of us do not have the time to research, follow and hold more than 10-15 stocks at one time.  We inevitably get busy with other priorities and can easily lose track of performance and the vagaries of a company’s operating results.

Keeping track of too many positions frequently results in time lost doing more important leisurely activities. Give the randomness and often volatile character of the financial markets, micro-managing positions, setting and adjusting stops repeatedly and searching for new positions via software tools or newsletters, is extra worth that is likely not a good use of time (but is certainly likely to drive up transaction costs and cause whipsawed results). 

To build a respectable mix of diversified investments, consider strong companies each representing an industry “in favor” with the current economic trend.  Characteristics to look for include consistent revenue and earnings growth, historical bias to upside earnings surprises, return on equity of 10% or higher, growth at a reasonable price (i.e. a PEG ratio, or Price Earnings-to-Growth Ratio, of 1.5 or less), and positive cashflow. These are simple factors that help define a quality company at a reasonable price.

So when the Baseline Analytics TrendFlex score is in “BUY” mode, hopefully you have built a list of such companies and kept them in your back pocket for the trend to support establishing a long position.   Try not to hold more than 15 of such companies (10 would be better), and let them ride with the trend. 

Should the TrendFlex Score turn to sell, don’t necessarily abandon these winners. Consider hedging with futures, selling calls to collect option premiums, reduce your holdings or protect them with index puts.  All too often we have looked back at strong companies we sold too soon as they continued to move toward new highs.  Take a longer-term perspective with these winning companies, but hedge your market exposure with other methods in the meantime when the trend turns negative.

Visit Baseline Analytics TrendFlex for Investment Rule #1.

Saturday, June 30, 2012

Strong Breadth Supports Rally

Friday's 277 point gain in the Dow was supported by strong breadth, a positive reinforcement of bullish enthusiasm. Indicators of breadth include Up/Down Volume, Advancers vs. Decliners, and New Highs vs. New Lows.  as the chart below demonstrates, all three indicators bolted higher on Friday:


Notice the recent high achieved in the NYSE Advance/Decline ratio and in New Highs vs. New Lows. Continued strength in these indicators bode well for a sustained market uptrend.

Subcribe to our TrendFlex market timing system where market breadth and several other major market and economic indicators help keep investors on the right side of the market.

Sunday, June 24, 2012

Seven Rules for Successful Trading

Trading is a business.  Track your results, review and learn from them, modify your strategy if you need to improve those results, and book profits.  Your first goal is capital preservation. Your second goal is to take on risk when the odds are significantly in your favor. Below are suggestions from lessons learned from technical analysis and money management.

Seven Steadfast Rules
Routinely take profits. It has never been discouraging to take a profit. Often, it is satisfying to take a loss in order to close out a position.  Don’t let a profit turn into a loss. Short-term trades may yield returns much higher than long-term holds which revert to average market returns.

Beware of Complacency. Just when all is going very well, when your equity curve is at its peak, the following will happen: a market correction, heavier than normal credit card bills to pay, a new roof needed on the house. Be flexible and adaptable to changing market conditions. Don’t fear leaving money on the table. 
Trade during strong trends and let your profits run. Strong trends occur only 30% of the time. This suggests that the majority of the time is spent churning through various mediocre and unprofitable trades.  Is it worth it? Buy and hold strategy excels within intermediate-term strong trends. 
Technical tools should be considered in the context of the prevailing trend. Don’t over-emphasizing technical signals: look for price behavior to confirm your technical observations. Prefer to catch the trend after it has started rather than anticipating too early and getting stopped out or missing a rally. Don’t get entranced with too many sophisticated technical signals: keep it simple.  
Buy, sell and set stops at technical support and resistance levels. This practice will help you to establish entry points at a more favorable reward/risk price, will keep you from tolerating a standard stop loss % or $ amount, and will permit a narrower stop loss.
Stick with a system, track your results and learn from them. Trading is business, not entertainment.
Continuously seek opportunities, but don’t over-trade. There are always stocks and sectors in their own Bull Markets and Bear Markets. Trade both. Short sectors rather than indices. Long winning stocks in clear uptrends. Find the opportunities and stick with the rules.
Visit Baseline Analytics TrendFlex and subscribe to our market trend timing signals.

Sunday, May 27, 2012

Investment Rule #1: Invest During Strong Trends and Let Your Profits Run

Many investors and traders get caught up with the day-to-day gyrations and noise of the financial markets. Market timing is at best a game of chance; ask any market "technician" to cover the right side of a chart with a piece of paper, and then forecast what will happen as that paper is removed to reveal the actual market activity. Directionally, the forecast might be correct. But was it correct in the timeframe expected? Jumping in and out of the financial markets based on the expectation of a trend change within a certain timeframe is a 50/50 proposition.

Furthermore, beware of market technical indicators that can often be misunderstood and improperly applied. For example, during a strong trend, you may hear from a market technicial that the market is "overbought." While that may be true, is it worth moving out of stocks for what might transpire as a minor short-term trading range? Technical indicators should be considered in the context of the prevailing trend. It is often better to "dumb down" the plethora of technical signals and keep it simple.

How does Baseline Analytics TrendFlex include Investment Rule #1 in its investment strategy? TrendFlex does use a handful of technical analysis signals as part of its strategy. But since TrendFlex is a trend-following system, short-term technical signals are used to assess the risk of the current trend changing. Typically, during a strong trend, a shift in the direction of the market (often confirmed by short-term technical signals) will not signify a true trend change. Baseline Analytics utilizes a "longer-term" blend of technical signals designed to keep an investor on the right side of the market. TrendFlex helps define the risk of a trend change and suggests a variety of actions to help protect profits as the trend weakens.

Sunday, May 6, 2012

Baseline Analytics Market Tour has been discontinued

While out research continues, Baseline Analytics has discontinued publishing its Market Tour Blog. Please visit Baseline Analytics TrendFlex for our latest tool to kep investors on the right side of the market and watch their wealth build.