Friday, June 11, 2010

Short-term bottoming process continues

The equity markets continue to support our observations noted earlier (see June 6 comment). A few noteworthy considerations:

  • The February lows are holding. A continued basing pattern around these lows will enhance the significance of this support level.
  • Nasdaq's relative performance has been waning relative to the S&P500, a sign that the risk profile is shifting to the "bluer" chips. Note in our Stockcharts.com Market Tour that small caps performance has begun to trail large caps.
  • Typical seasonal strength in June/July
  • The dollar, which has trended inversely to stocks, has hit resistance at its April 2009 highs (while MSCI Pacific index finds support at the Q4 08-Q1 09 highs).
  • As for market sentiment, the Volatility Index (VIX) closed below the RSI 50 level (albeit slightly) while Put/Call remains stubbornly high (both contrary indicators).

Sunday, June 6, 2010

Basing pattern in place

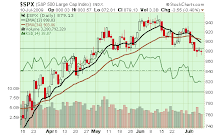
SPX remains caught below its 200-day moving average but sits at support at the February lows. RSI is nudging its way higher in a modest positive divergence. Sentiment indicators reached extreme readings (a contrary bullish sign), however, internal damage to the market suggests a need for more time to base rather than an impending bounce in equities.

We track the McClellan Oscillator (NYMO) for signs of market extremes. Normally, we would see a bounce in equities as this indicator rises from an extremely low level. Recently, this indicator hit an extreme low and bounced with little improvement in the equity markets. A similar reaction was seen in Nov 09 when SPX remained range-bound until it broke out in Dec. Put/Call remains at a high extreme (bullish) and likely to trigger a bounce in equities.

Value stocks have recently surpassed growth in relative strength (measured by the Russell 2000 growth and value indices). Small caps have also maintained favor over large caps, although a divergence can be seen as small cap RSI is weakening (and RSI for large caps recently reversed upward from oversold under 30). This could suggest the move into large cap value for safety.

We expect equities to remain choppy and form a longer base before embarking on another leg upward. We expect that any positive macroeconomic or global news will propel the markets higher, and we suspect that negative news may begin to have a more muted effect as equities seek a firm footing.

Click here for the latest Market Tour on StockCharts.com.

Monday, May 31, 2010

Bullish Bias

As equities struggle to find support at their February lows, various measures of breadth and sentiment recently printed extreme readings,favoring a bounce in equities. The 13-day EMA of the put/call ratio, for example, has been over 1.10 since early May, suggesting continued fear, desire to protect gains and outright bearish bets. This indicator reached these levels in October 2008 (as equities swooned) in the midst of much more severe economic conditions. The dollar also appears to be forming a short-term top; its reversal may lend support to a short-term uptrend in equities. Oversold foreign markets also appear to be settling into support zones.

Click here for the latest Market Tour on Stockcharts.com.

Wednesday, May 19, 2010

Short the bounce

As we believe a top has been reached in the rally since March 2009 (the top was achieved in late April), any bounce from today's deeply oversold environment will invite further shorting opportunities. The weekly charts in the major indices have started to break rising uptrend support. We suspect any bounce will be tepid.

Weak market breadth and high volatility support a short-term bounce. VIX has widened the gap from its EMA 34 (extreme gaps in the past have preceded market turns). The Put/Call ratio closed at its highest since November 2009 (while the equity markets were in the throes of capitulation), and its EMA 13 closed above 1.0 (again not seen since November 2009).

The dollar, which has been moving inversely to equities, appears to be forming a short-term top, another potentially bullish sign for stocks.

We plan to go short-term long with tight stops in preparation for a continuation of the downtrend, reversing to short for the intermediate-term when the expected bounce is exhausted.

Click here for the latest Market Tour on Stockcharts.com.

Monday, May 10, 2010

Neutral bias

Market breadth was so excessively weak following Friday's sell-off, that even without the events in Europe, we would have expected a bounce in the near-term. Development in Europe accelerated that bounce in a convincing way. We expect the market to retrace a portion of this rise before moving higher.

Click here for the updated Market Tour.

Sunday, April 25, 2010

Marking Time

Equities continue to push toward new highs; advance-decline stats have improved as market participation in the uptrend widens. An interesting deterioration in growth relative strength vs. value suggests repositioning (we have not seen the move from small caps to large caps, but there has been much talk about that recently -- large-cap, dividend-paying equities). Put/Call ratio (particularly its EMA 13) has been downtrending while VIX remains in the basement, both cautionary indicators.

Gold and the Dollar have move in tandem (up) since early 2010, which in the past has preceded a decline in treasuries (which are looking wobbly these days as rates firm). Corporate bonds (LQD) have fared much better as retail funds have pushed into this sector.

Click here for the recent Market Tour on Stockcharts.com.

Monday, April 5, 2010

Risk/Reward favors caution

No doubt the equity markets have been on a bullish run that appears (based on market internals) fragile. We continue to favor tighter trailing stops on longs and partial hedges on short positions.

Click here for the latest Market Tour:

http://stockcharts.com/def/servlet/Favorites.CServlet?obj=ID2738712