Tuesday, July 28, 2009

Tuesday Update: Uptrend ready to pause


Short-term: Neutral
Click here for Market Tour

SPX formed a hanging man at its high today as it works through a sideways consolidation. Advance-Decline data has weakened (for both SPX and Nasdaq) but remain positive. A firming dollar threatens to move contrary to equities, where firming bond prices also point to a modest rotation from equities. Any correction is considered a 4th wave of a 5-wave uptrend and should be mild. A 1-3% retracement from current levels would convince us to add index longs. We will continue to scan for high reward-risk entry points in strong relative strength stocks.


Sunday, July 26, 2009

Weekend Update


Market Position:


Short-term: Neutral

Medium Term: Bullish

Long Term: Bearish


SPX remains firmly bullish as RSI breaks into overbought levels above 70 (where it can remain while an uptend continues). Both the DOW and Transports are in an uptrend (however the DOW has breached its 2009 high but the Transports have not). Price relative of financials has weakened as other sectors (paricularly healthcare and utilities) take up leadership. This is a bit of a concern and a potential early sign of sector rotation into defensives. Consumer Discretionaries took a hit on Friday as Staples bounced.


Nasdaq is showing signs of weakeness; its price relative to SPX is waning, its advance-decline line backed off from overbought resistance, and the steepness of its short-term uptrend slope begs for sideways action. Stocks above their 50-day moving average have bumped up against overbought resistance.


Strategy: enter new longs (and add to existing long positions) on a pullback. Raise stops and take partial profits on winners.


Thursday, July 23, 2009

Uptrend builds strength

Market position: Bullish

SPX had butted up against resistance near 940 three times this year, finally breaking through on strong volume today. Market breadth and sector participation on the upside is strong. Dow Theory confirmation was "further" confirmed today with new recovery highs in both indices. We plan to add long positions in basing, strong relative strength equities and cost-average into the indices.

Click here for charts


Tuesday, July 21, 2009

Uptrend continues; Upside participation thins out; Dow Theory Confirmation

Neutral
Click here for charts

SPX broke through resistance near 950 today; next support near 925. Advance-Decline ratio for both NYSE and Nasdaq have weakened during the last few days; the rally may become a stock-picker's rally for a while as recent gains consolidate. Another reason for a consolidation of recent gains is the behavior of the dollar, The dollar may have formed a bottom (today's doji possibly marks the end of a 5-wave downtrend). As the dollar has moved inversely to stocks, we may see a bounce in the dollar correspond with a decline in stocks.


As for Dow Theory, a recovery high in the Dow corresponded with the Transportation Index meeting its recover high, very close to a confirming signal on the upside.

Saturday, July 18, 2009

Proceed with caution: the uptrend's mixed signals


Market Position: Neutral-Bullish.


While we cannot ignore the strong price action as the market breaks to the upside, we cannot ignore technical signals that point to caution. SPX is bouncing up against resistance (for a 3rd time) since its January 2009 high. Each break upward since March has been on lighter volume (part of which can be attributed to lower seasonal activity). The Put/Call ratio at .74 is nearing the low levels where market pullbacks have occurred. VIX (albeit bullishly low) has gapped below its EMA to an extreme. Also, the Nasdaq has incurred a few too many "gaps up,"and financials relative strength (after a few strong days) has flattened again.


Out strategy is to add to longs on a pullback (3-5%) in SPX and in strong relative strength stocks.


Thursday, July 16, 2009

Thursday Update

The uptrend continues. We will hold off adding to longs without a modest pullback; focus on momentum stocks (i.e. IBD 100) with basing patterns and modest retracements. Those coming late to the rally might consider a short hedge.

See our latest update on Stockcharts.com.

Wednesday, July 15, 2009

Uptrend Resumes


Market Position: Bullish

Subtle signs of an oversold market and potential turnaround, as noted in this blog this week, manifested themselves into a breadth-intensive rally. With bumps along the way, we expect the market to hit new 2009 highs. Out SPX target is 1100-1200 in this countertrend (bear market) rally.

Tuesday, July 14, 2009

Tuesday Update


Market position: Neutral.


The subtle signs of an oversold market which were referred to last time, have enabled a change in the current downtrend from a possible significant correction (i.e. SPX to 800-840) to a minor retracement of recent gains (SPX 880). From a technical standpont, it appears that SPX and other indices are forming a flag (downtrending trading range) as a pause in the rally from the March lows. We are currently neutral, as it will take a breakout (either way) to turn firmly bullish or bearish.


Monday, July 13, 2009

Semiconductor relative strength


Note the chart below showing the relative performance of the Taiwan ETF (iShares) vs. EPP (MSCI Pacific ex-Japan), as well as the SMH vs. SPX. Taiwan is comprised of a relatively large market cap of semiconductor shares. Recent relative strength of Taiwan (since mid-June) and consistent strength of SMH (which has held up well during this recent correction) is a sign of internal market strength in technology and a positive leading indicator of an eventual recovery.

Sunday, July 12, 2009

Dollar moving closer to a bullish breakout


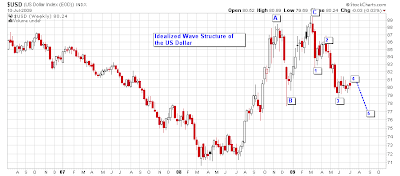
Although the US Dollar has firmed recently, we believe it is in a Wave 4 of a 5-wave downleg. Once completed, we expect the dollar to uptrend with a target in the mid-upper 80's (Friday's close was 80.24).

Dow Theory Update


Dow Theory looks for consistent price behavior in the Dow Jones Industrial Average and the Dow Jones Transportation Average. One should confirm the other (i.e. if the DJI hits a new high, the DJT is expected to follow closely). In early June, the DJI hit a recovery high (from the March lows) while the DJT hit a double top. The DJT's inability to hit a new high was a Dow Theory non-confirmation Since that time, both indices have been falling (now they are confirming the current downtrend).


Saturday, July 11, 2009

Weekend Update


Summary: Neutral-Bearish


Subtle signs of an oversold market have emerged as the major indices continue to trend lower. Much attention has focused on head and shoulders topping patterns in DIA and SPY; lower highs and declining relative strength underscore the downtrend. Put/Call 5-day EMA has closed above 1.0. Commodities have firmed (albeit for a couple of days, although their 50% correction of gains from March could suggest a favorable risk/reward for longs) as the dollar weakens. Oversold readings in stocks over their 50-day moving averages are a contrary positive. Our initial downside target in SPX is anothr 5-6% loss (to the 840-850 area). We believe the uptrend will continue once such support is reached.


Friday, July 10, 2009

Thursday Update

Major indices continue to trend lower. Much attention has focused on head and shoulders topping patterns in DIA and SPY; lower highs and declining relative strength underscore the downtrend. Put/Call 5-day EMA has closed above 1.0, however, the P/C reading is not at an overbought extreme (which could build confidence in a bounce). Commodities have firmed (albeit for a couple of days, although their 50% correction of gains from March could suggest a favorable risk/reward for longs) as the dollar weakens.

Wednesday, July 8, 2009

Tuesday Update


Market correction continues as major indices break support. A breakout of VIX above its downtrend line and Dow Theory non-confirmation (INDU and Transports), as well as weakening market brreadth, contributed to the corrective equity picture. We anticipate a buying opportunity following SPX correction to the 800-840 level.


Saturday, July 4, 2009

Weekend Update


The equity markets are currently undergoing a correction which we expect will offer buying opportunities in the months ahead.

Visit out Market Tour on Stockcharts.com.


Consumer Staples Taking the Lead


In late February, consumer discretionary stocks took the relative strength lead vs. SPX, as consumer staples lagged. In May, however, that relationship has reversed, underscoring a more cautious market.


Thursday, July 2, 2009

Potential Wave Structure: SPX


Here is our hypothetical wave structure for SPX. SPX completed Primary Wave 1 downtrend in March 2009. Primary Wave 2 countertrend rally will likely break into 3 waves, the first of which (A) has completed. We are currently in Wave B of Primary Wave 2.


Wednesday, July 1, 2009

Select sector ETF's have been breaking down

XLB (materials) weakening; similar setups can be seen in XLF and XHB. Click on the chart for a larger view.